
Outage Data & Visuals for Newsrooms
National and local outage numbers, rankings, and map-ready geometry for on-air and digital coverage.
- 96.04%US Coverage
- TopStates & Counties
- Map-ReadyGeometry
- REST / JSONFormat
The problem
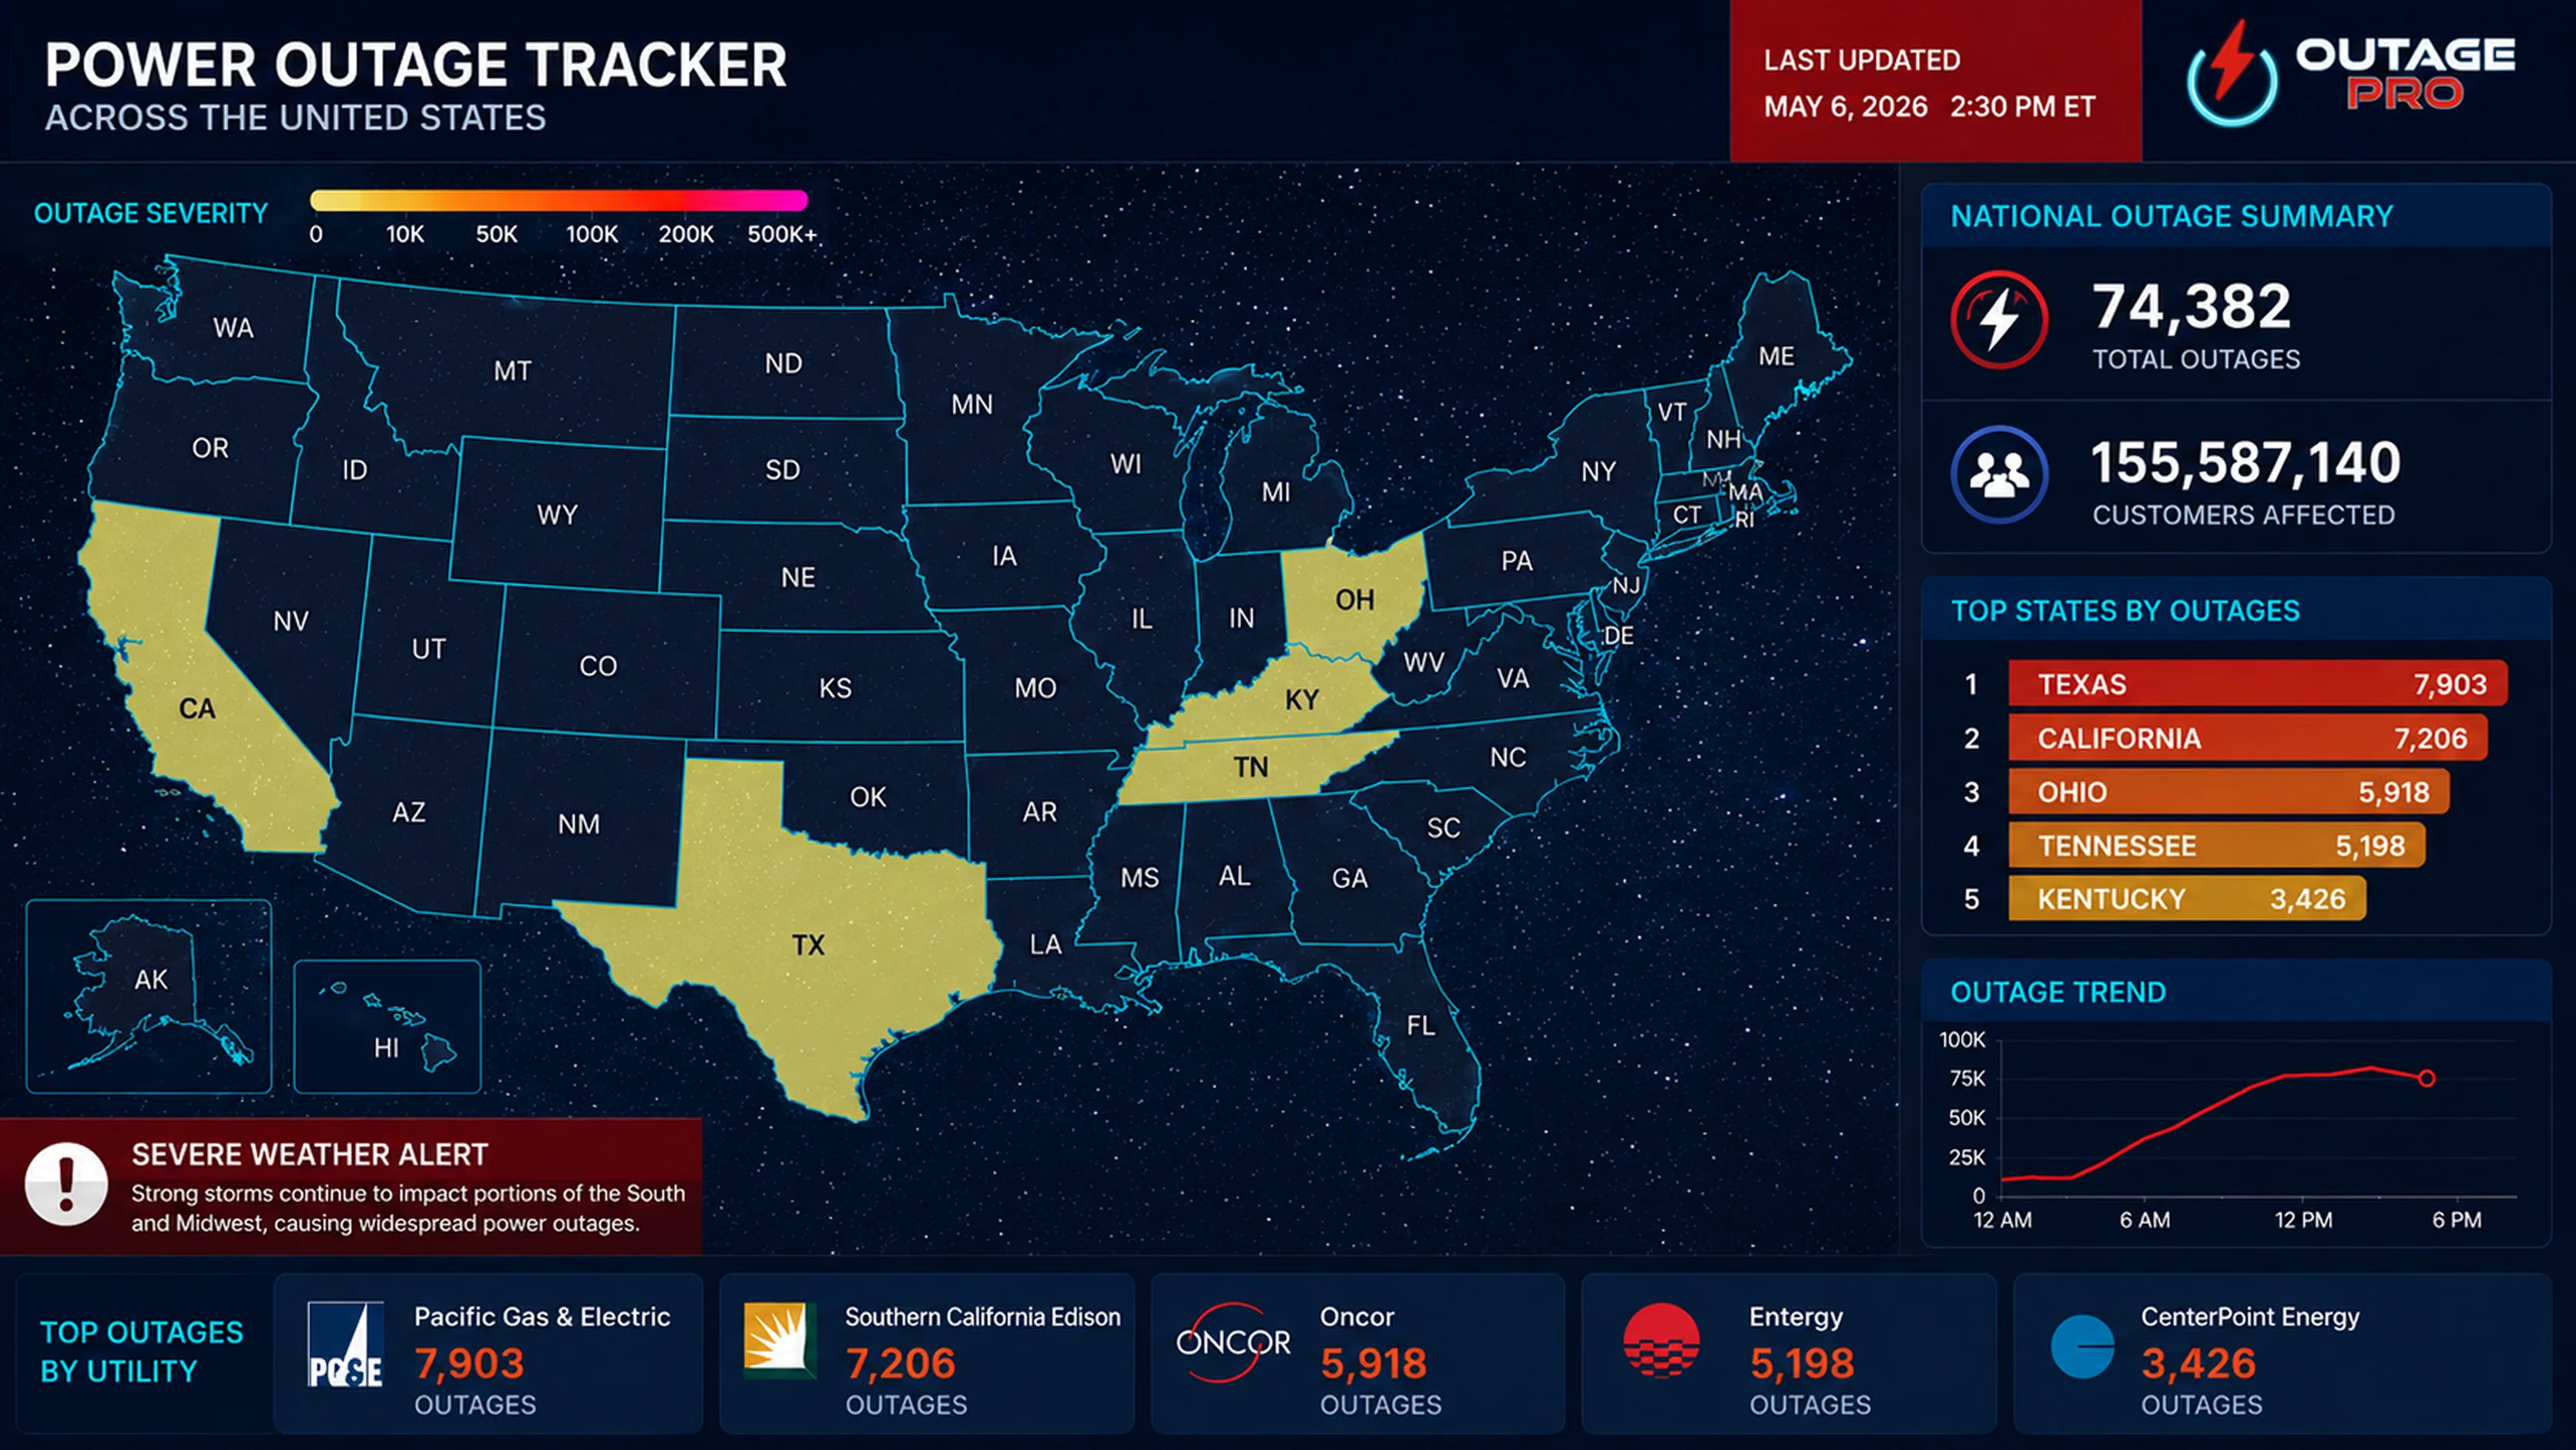
Newsrooms and weather teams need credible, current outage numbers — on air and online, fast, and from a source they can cite. Manually tallying figures from utilities doesn't scale to breaking coverage. Outage Pro provides ready-to-air outage data and map-ready geometry: national and local counts, the most-affected states and counties, and the visuals to back the story — all updated continuously.
Key data points
- National total outages & customers out
- State- and county-level counts and outage %
- Top states & top counties rankings
- Full utility list
- County GeoJSON for broadcast and web maps
- Last-updated (UTC)
Key benefits
- 01
Credible, citable numbers
A consistent third-party source for on-air and digital.
- 02
Ready-to-render maps
County GeoJSON for severity maps in your graphics stack.
- 03
Instant rankings
Top states and counties pre-ranked; no client-side sorting.
- 04
Breaking-event alerts
Webhooks push the moment outages spike.
- 05
Easy to integrate
REST/JSON feeds into CMS, graphics, and dashboards.
Who it's for
- TV & Weather Teams
- News Digital Desks
National power outages
- Customers Out
- 55,542
- Customers Tracked
- 158,442,396
- States Tracked
- 52
Top affected states
| State | Customers Out | % Out |
|---|---|---|
| Texas | 8,968 | 0.06% |
| Pennsylvania | 8,543 | 0.13% |
| California | 7,034 | 0.04% |
| New York | 3,766 | 0.04% |
| Florida | 3,362 | 0.03% |
Last updated 08/28/2026 10:00 AM
Ready to Cover the Story?
Talk to our team about outage data and map-ready visuals for your newsroom or weather desk.
Talk to Our Team