

County-Level Outage Awareness for State Emergency Teams
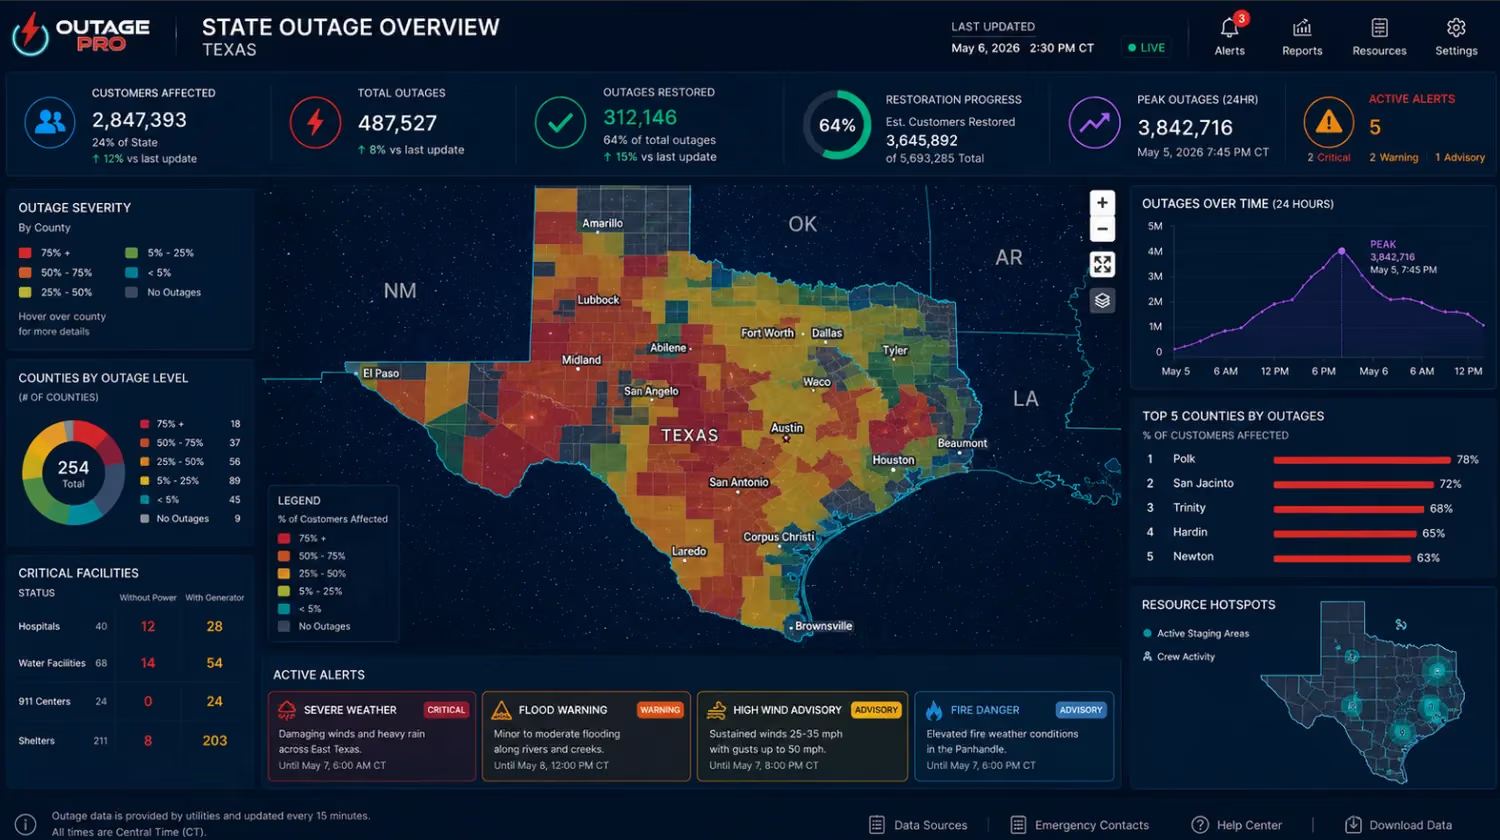
Live outage severity down to the county, with the hardest-hit counties surfaced automatically.
- County-LevelDetail
- Top-5Counties
- Map-ReadyGeometry
- WebhookAlerts
The problem
During a statewide event, emergency managers need to know which counties are hit hardest right now to prioritize crews, shelter decisions, and public messaging. Pulling that county by county from utility sites wastes critical minutes. Outage Pro delivers live, county-level outage severity for your state — with the worst-hit counties surfaced automatically — so your team can prioritize from a single, current view.
Key data points
- County-level customers out & served
- Outage % per county (current severity)
- Top-5 counties by customers out
- County → utility drill-down
- County GeoJSON for a state heat map
- Last-updated (UTC)
Key benefits

Prioritize fast
Hardest-hit counties ranked automatically; no manual sorting.

County-level clarity
Severity for every county in your state from one feed.

Drill to the cause
See which utilities are driving a county's outages.

State heat map ready
County GeoJSON renders severity maps instantly.

Stay ahead with alerts
Webhooks trigger when a county crosses your threshold.
Who it's for
 State Emergency-Management Departments
 County EOCs
County-level awareness for EOCs
When a storm hits a whole state, the first question is always the same: which counties are worst off right now? Outage Pro answers it without anyone checking county by county. The page shows live outage severity for every county in the state, with the hardest-hit counties ranked automatically, so a state EOC can prioritize crews, shelter decisions, and public messaging from one current view. Each county shows its customers out and customers served, the outage % for that county, and a last-updated time, so briefers know how fresh the number is. From any county you can drill into the utilities behind its outages, which turns "the northeast of the state is dark" into a real list of where and who to send crews. That level of county detail is what an EOC needs early in an activation, before the picture is clear anywhere else.
From daily monitoring to activation
The same feed works on a quiet Tuesday and during a landfalling storm. On a normal day, staff watch baseline conditions and catch the first outages as they appear. As an event builds, that quiet monitoring turns into an activation without anyone switching tools. Instead of refreshing utility pages, you set thresholds and let webhooks do the watching, so an event is pushed the moment a county crosses the level you care about and the EOC hears about it instead of finding out late. One current, county-level view carries the team from the first sign of trouble through the peak of the response.
Coordinating with counties and utilities
A response runs across agencies, counties, and utilities, and they all need to be looking at the same numbers. Because Outage Pro is an objective, third-party feed, state teams, county EOCs, and partner agencies get one shared picture instead of a pile of utility screenshots. Optional county GeoJSON renders a statewide severity map inside your own GIS and dashboards without sourcing boundary files, so a common operating picture is straightforward to set up. Everyone plans and briefs from the same neutral, consistent figures.
Frequently asked questions
National power outages
- Customers Out
- 118,774
- Customers Served
- 159,700,055
- States Tracked
- 52
Top affected states
Last updated 10/18/2026 07:12 AM
- 010.49% outCaliforniacustomers out78,515
- 021.43% outWest Virginiacustomers out14,464
- 030.07% outIllinoiscustomers out3,823
- 040.02% outTexascustomers out3,148
- 050.09% outSouth Carolinacustomers out2,766
Ready to Prioritize Your Response?
Get API access to county-level outage severity for your state emergency-management team.